Know the measurement levels of your variables
It is important to know the measurement levels of your variables (De Muth 2009).
Why?
Because the level at which your variables are measured determines how you analyze them. There are rules governing what you can and cannot do with variables at different levels of measurement.
Nominal
Nominal measurement is categories.
Each student (or patient) must fall into only one category. The categories must be also mutually exclusive and exhaustive. Here are some examples:
- Gender (Male/Female)
- Racial identity (White/nonwhite)
- Marital status (Married/non-married)
- Control group/Experimental group
- Infected with COVID-19 vs. not infected with COVID-19
- Disease presence
- Mortality (Alive/Deceased)
- Proficiency (Below standard / Meets or exceeds standard)
Nominal outcomes are usually reported as frequency counts or percentages (in each category), or, counts of people in different buckets.
I hope it is obvious that you cannot perform arithmetic on categorical data. It makes no sense to “average” gender or marital status.
But you can report percent of your sample in different buckets. If your outcome variable is categorical, you can study what percent of people end up in one category or another.
As an example from education, you can study what factors influence how many students ultimately meet a proficiency standard.
Ordinal
Ordinal measure also puts people into categories, but the categories have an ascending or descending order: people have more or less of something.
Consider student work that is scored on a rubric from 1 to 4. Student work scored with 4 demonstrates more of what the scorer is looking for than work scored a 3. Rubrics often have verbal descriptions of desired qualities, and a higher value declares that work possesses more of these desired qualities.
But the differences between the categories are not necessarily the same.
A score of 4 is more proficient than a score of 2 – but not necessarily by two times as much.
Here are some examples from medicine:
- Stages I-IV tumors
- 0-10 Apgar scores
A Stage IV tumor is more advanced than a Stage II tumor, but not necessarily by twice as much. A Stage III tumor is more advanced than a Stage I tumor, but not necessarily by three times as much.
Again, we cannot perform arithmetic on ordinal data. We cannot subtract ordinal data and get meaningful difference scores. Nor can we calculate means or other parametric statistics on ordinal data.
But we can express ordinal data in categories. We can report percent of students who scored at SBAC Levels 1, 2, 3, and 4.
However, if your project has an ordinal outcome on which you need to compare treatment groups, there are appropriate nonparametric statistics you can use to see which group is significantly more of this outcome than another. Examples include:
- chi-square \(\chi 2\) statistics
- the Mann-Whitney U test
- the Spearman’s rho test
Likert scales fall into this category. Consider
- Strongly disagree
- Disagree
- Agree
- Strongly agree
Interval and ratio
Finally, interval and ratio measurement means continuous data.
This means people fall along a continuum, like a temperature scale. Or, to use an example from education, a score scale, like that of the Smarter Balanced score scale, or the MAP RIT scale.
Variables measured using interval and ratio scales are often referred to as continuous variables. Here are some examples:
- Height
- Weight
- Cholesterol level
- Blood pressure
- Time
- SBAC scale score
- RIT score
- GPA
On variables like these there is relative positioning with no gaps or interruptions in the continuum.
The difference between interval and ratio scales is that ratio has a true zero value while interval does not.
On variables like these we can do arithmetic and summarize them with the mean and standard deviation which in turn avail to you more commonly used advanced statistics like:
- t tests
- analyses of variance (ANOVA)
- correlation
- regression
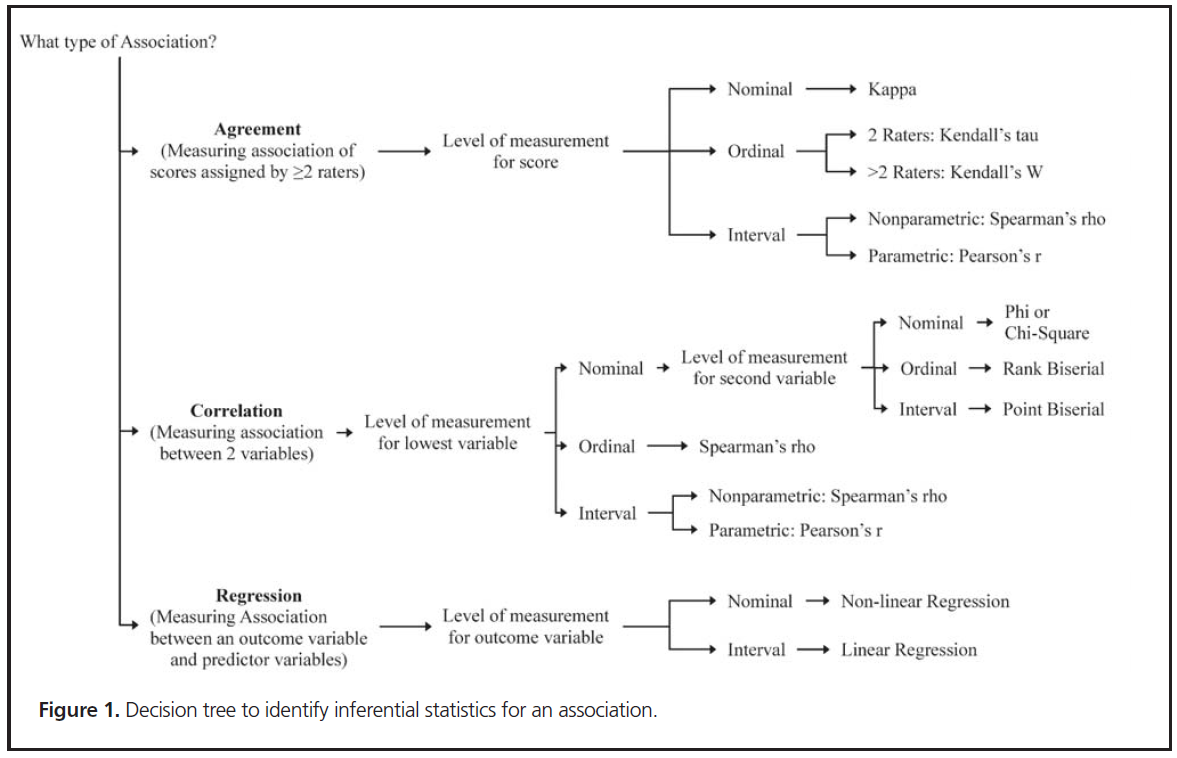
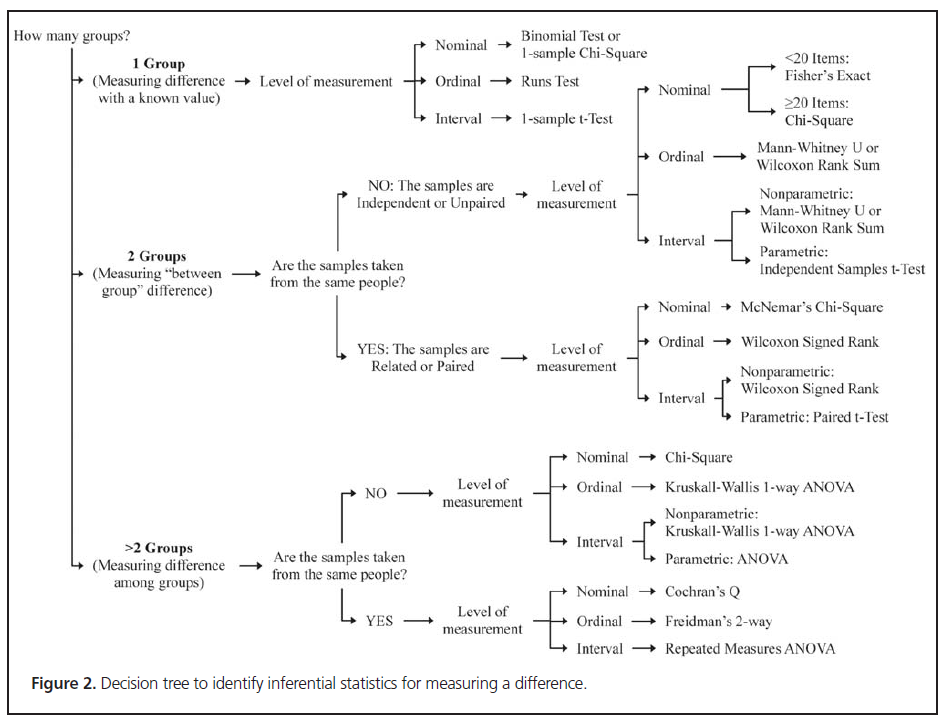
Once you have a good feel for the measurement levels of your outcome and predictor variables, you can choose appropriate statistics. Simpson (2015) offers two decision trees to help you make these choices: